Kurt Metzger is one of metro Detroit’s leading data analysts and demographers. He is director emeritus at Data Driven Detroit and previously spent 15 years with the U.S. Census Bureau in the Detroit Regional Office. He also served as a senior research analyst with the Center for Urban Studies at Wayne State University and the research director for United Way in Detroit. He is currently the mayor of Pleasant Ridge. In this guest blog, Kurt breaks down the latest U.S. Census population data, demonstrating the vital importance of immigration to Southeast Michigan’s growth and prosperity.
The 2020 Census found that 50 of Michigan’s 83 counties lost population since 2010, while 33 experienced an increase. Birth and death data for 2019 (the latest year final data are available from the State) show that 61 of our 83 counties experienced more deaths than births.
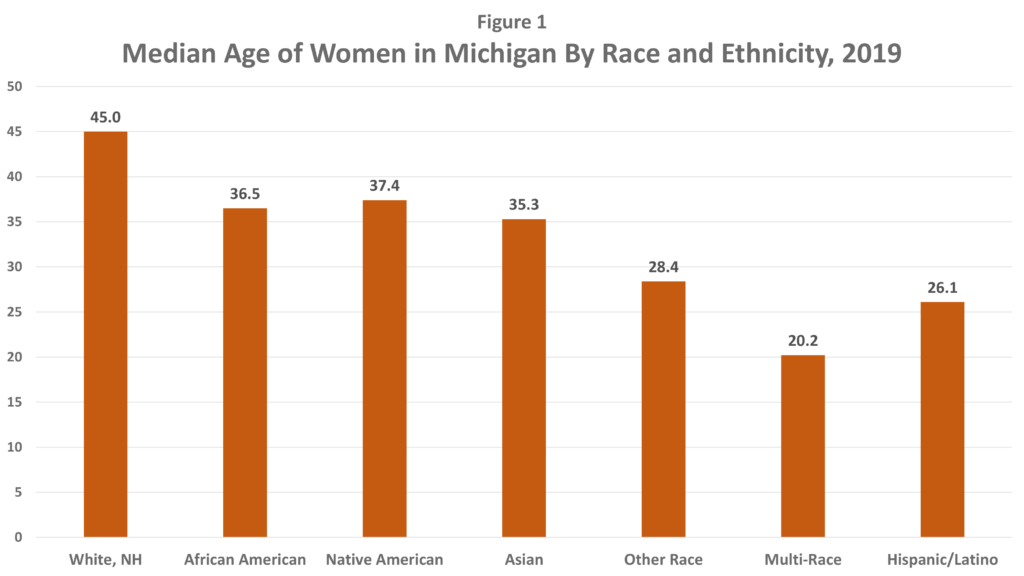
The number of births across the state of Michigan in 2019 was the lowest we have seen since 1941. While this birth drop is associated with a number of factors – persons waiting longer to marry; women pursuing advanced education; the increasing cost of raising children; general economic concerns; an aging population – I also attribute it to the fact that white, non-Hispanics make up a large proportion of Michigan’s population, and this group is aging faster than any other. (See Figure 1)

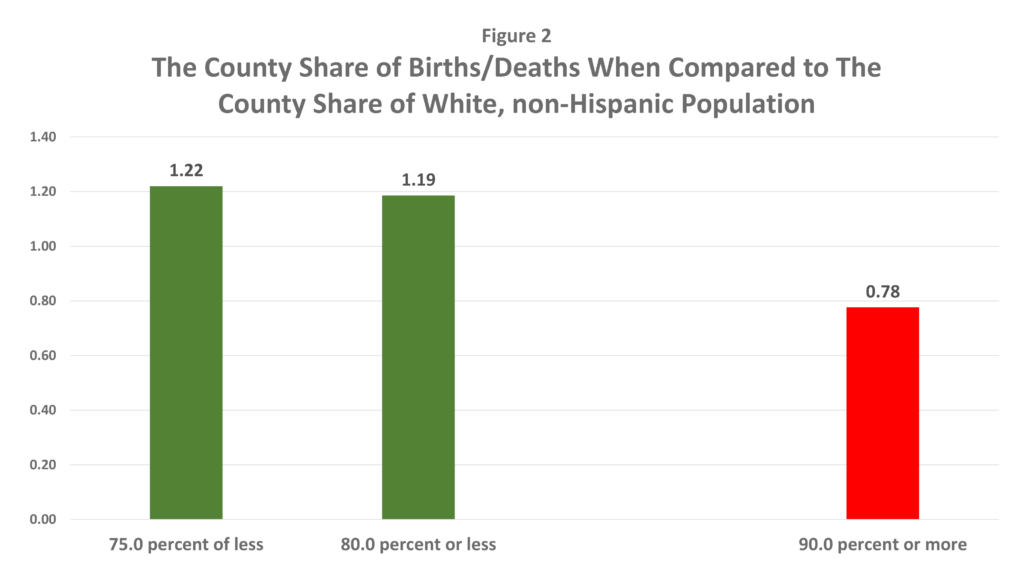
To test the effect of the racial composition of an area on its degree of natural increase (births minus deaths), I calculated the 2020 white, non-Hispanic share of each county’s population and compared it to the natural increase (births divided by deaths) to see what it showed.
I summed across all counties with a white, non-Hispanic share of 90 percent or more (35 counties meet that threshold) and all counties with a white, non-Hispanic share of 80 percent or less (19 in total), and 75 percent or less (14 in total), and compared each group on the natural increase.
The chart below (Figure 2) is quite clear. For counties with populations, 90 percent or more white, non-Hispanic, births average about 75 percent of deaths – deaths outnumber births 1.29 to 1. Unless these counties figure out a way to bring migrants in, their destiny is one of continued loss.

However, when the white, non-Hispanic share decreases to either 80 percent or less, or 75 percent or less, we find almost the reverse – births outnumber deaths 1.22 (or 1.19) to 1.
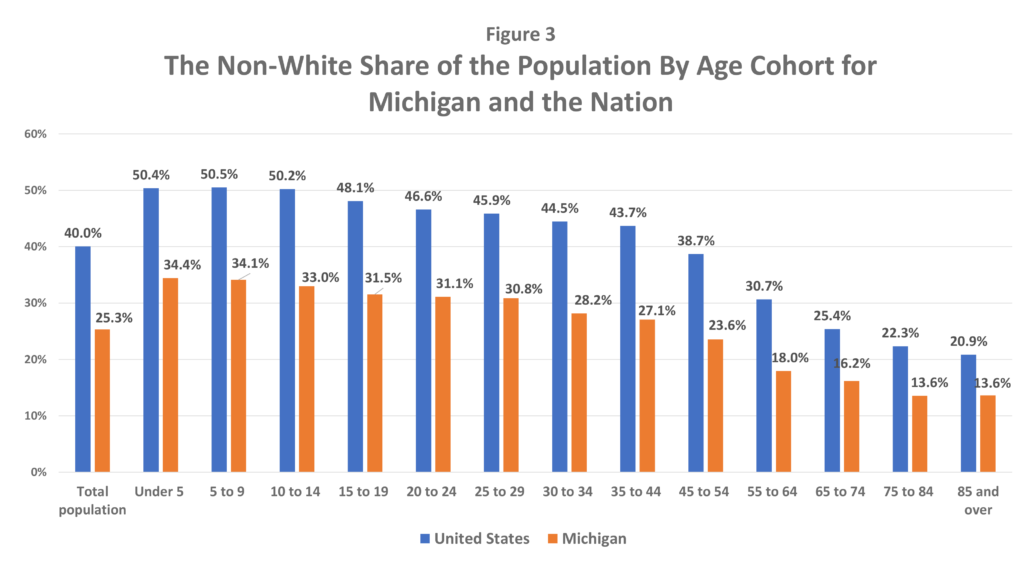
The final chart (Figure 3) shows the distribution of “persons of color” [defined as Total Population minus white, non-Hispanics] by age, for both Michigan and the United States. While Michigan is less diverse than the country as a whole, the trend of increasing diversity with decreasing age is quite clear. Nationally, children of color have already made up the majority of the population in the 3 youngest age cohorts. Due to our much larger share of white, non-Hispanics, Michigan is still well behind the national average. However, if Michigan can grow its share of the nation’s increasing immigrant and refugee numbers, as well as devise campaigns to attract immigrants from other parts of the country to join the strong immigrant communities already established across the state, we can expect to close that gap.
The bottom line…..Diversity drives innovation…Diversity drives growth.

